Denver, CO vs Boise, ID
Water, air, radon and what is registered nearby, from the public record for each county.
Boise, ID is lower on all four of the four
In the typical US county, 48% of what a utility tests for comes back above a health guideline. Denver, CO is at 48%, Boise, ID at 41%. Both are better than average.
Lower is not the same as low, and which of the four matters most depends on your house.
- Drinking waterBoise, ID
- Traffic emissionsBoise, ID
- RadonBoise, ID
- Registered sitesBoise, ID
What the utilities serving each area reported, compared against health guidelines rather than legal limits alone. A share rather than a count: a system that measures more analytes will always flag more of them.
- Above a health guideline
- Denver, CO24 of 50 · 48%the higher of the two
- Boise, ID22 of 54 · 41%
- Over a legal limit
- Denver, CO0about the same
- Boise, ID0about the same
- Furthest over a guideline
- Denver, CO513×
- Boise, ID3,409×the higher of the two
- Against every US county
- Denver, COHigher than 48%the higher of the two
- Boise, IDHigher than 20%
- What that is
- Denver, COPerfluorohexane sulfonate (PFHXS)
- Boise, IDPerfluorohexane sulfonate (PFHXS)
Boise, ID carries the further exceedance — about 7× the other's worst reading.
This is the water a utility delivers. A house on a private well is in none of it: a well files no report, so a test is the only way to know what is in one.
Utility reports as pulled on 7 July 2026.
What road traffic releases across each county every year, from EPA’s emissions inventory, divided by land area. These are county-wide totals of what goes into the air — not a reading taken at an address.
- Worst pollutant
- Denver, COFine particles (PM2.5)
- Boise, IDFormaldehyde
- All eight, per square mile
- Denver, CO2.0 tthe higher of the two
- Boise, ID0.23 t
- Against every US county
- Denver, COHigher than 99%the higher of the two
- Boise, IDHigher than 91%
Denver, CO releases about 8.9× as much per square mile.
EPA National Emissions Inventory, 2020.
EPA’s predicted zone for each county, from geology and the indoor measurements that already exist. Zone 1 is the highest. Radon comes in through the foundation, so two houses on one street can differ by more than these zones differ from each other.
- EPA radon zone
- Denver, COZone 1 — predicted above 4 pCi/Lthe higher of the two
- Boise, IDZone 2 — predicted 2 to 4 pCi/L
Denver, CO sits in the higher-risk zone, but the building decides the answer in either.
Superfund sites and Toxics Release Inventory facilities on the federal registers in each county. Being on a register means a site is recorded, not that anything from it has reached a home.
- Sites on file
- Denver, CO20the higher of the two
- Boise, ID12
Denver, CO has more sites on the federal registers.
If you test one thing
Taken from the record above, in that order: anything above a legal limit first, then a county EPA puts in radon zone 1, then the furthest reading over a health guideline. A starting point drawn from the county — not a finding about a house.
- Denver, CORadon, in the airEPA puts this county in zone 1, where indoor readings are predicted above the level it says to act on. Radon comes in through the foundation, so the county tells you to test and only a test tells you the house.
- Boise, IDYour tap waterNothing here is above a legal limit. Perfluorohexane sulfonate (PFHXS) is 3,409× over a health guideline, which is advice rather than law, and the furthest of anything in this county's record.
None of this was measured in a house
Everything above is the public record for a county — what the utilities reported, what traffic releases, what EPA predicts from the geology. The pipes between the plant and one kitchen are not in any of it.
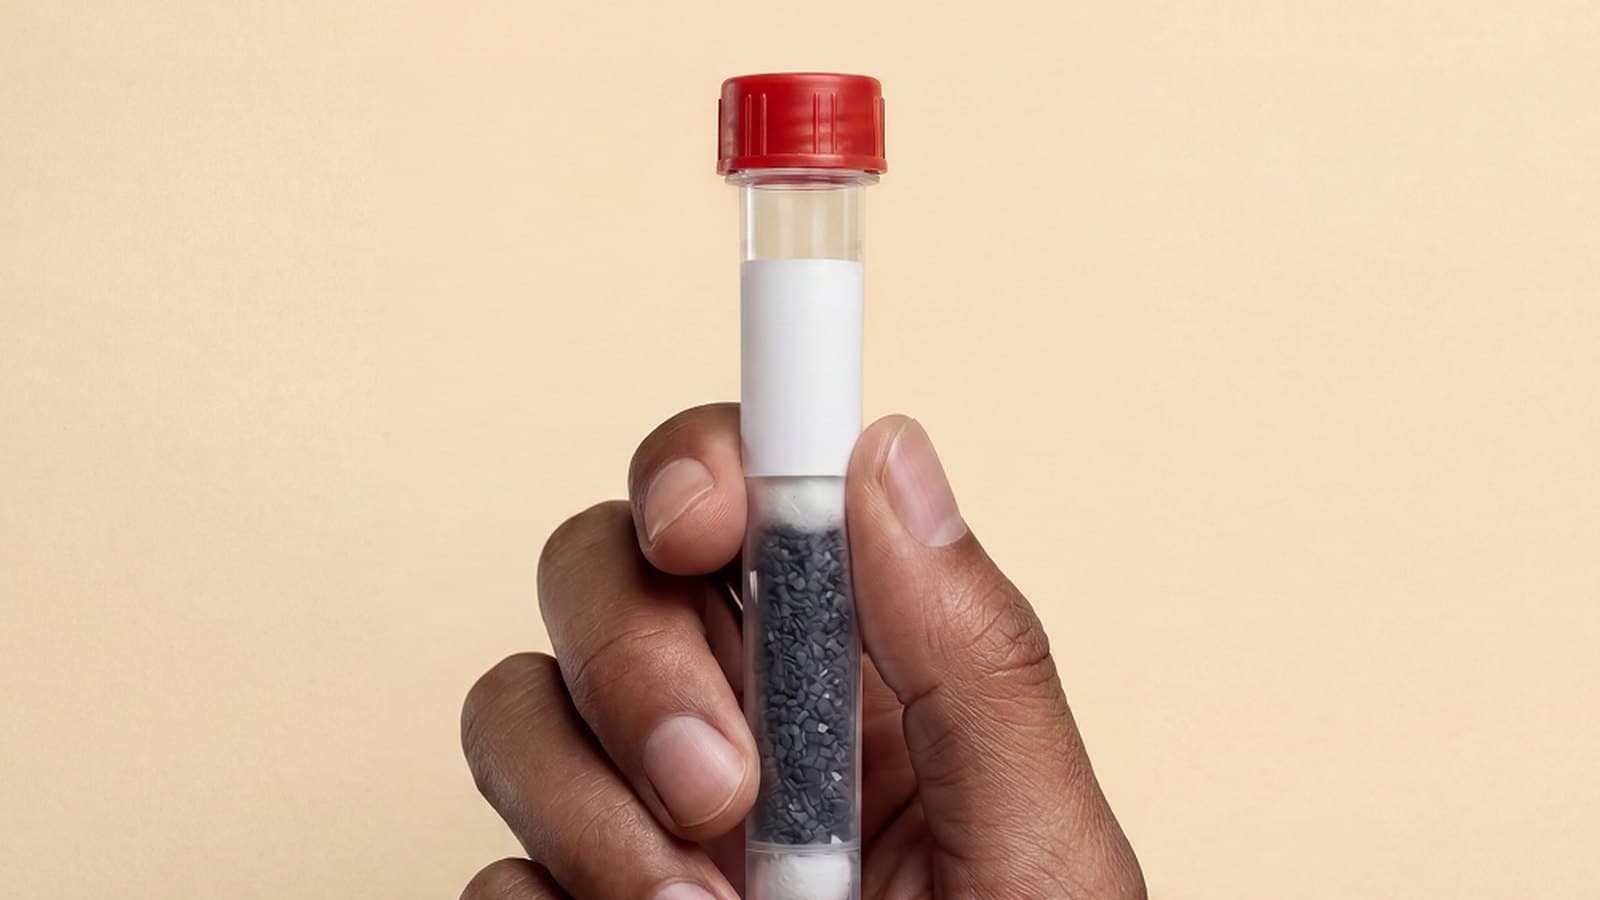
The report is free and takes an address. Results from a kit arrive in about 10 days.
Other comparisons
Nestwell screens your home environment. Results describe your water, air, or dust and are not a medical diagnosis. Everything above is a public record for a county — none of it was measured inside a home.
About this comparison
Denver, CO is read from the public record for Denver County, and Boise, ID from Ada County. Each covers the whole county, so it describes the area around a home rather than any one street or house.
Drinking water is compared as the share of what each area’s utilities measured that sits above a health guideline, not as a count. A utility that tests for more will always flag more, so a raw count tends to make the less-tested place look better.
Registered sites are counted up to 30 per county. Most large metros reach that, and when both places do, the page says the two cannot be told apart rather than calling it a tie.
There is no overall score: in a city it mostly measures how dense the place is. Each category is shown on its own so you can weigh the ones that matter to you.
What to do with what you found


Questions about this comparison
- Where does this comparison come from?
- The public record for each county: what the local water utilities reported, traffic emissions from the EPA National Emissions Inventory, the EPA’s radon prediction from the area’s geology, and the sites registered nearby.
- Why is there no overall score for each place?
- Because in a city it mostly measures how dense the place is. Traffic and registered sites run high in almost every metro, so a single number would rank nearly every city you would want to compare at the bottom. Each category is shown on its own instead.
- Does this tell me what is in my home’s water or air?
- No. It describes a county, not a house. The pipes between the treatment plant and one kitchen are not in any of it, and neither is the air inside a particular home. A home test measures what is actually there.
- Why do two cities show the same results?
- The record is kept by county, so two cities in the same county share it. The page says so when that happens.