Home testing vs. body testing: what each one tells you
You can test your blood for lead. You can also test your kitchen tap for lead. They sound like the same question. They aren't.
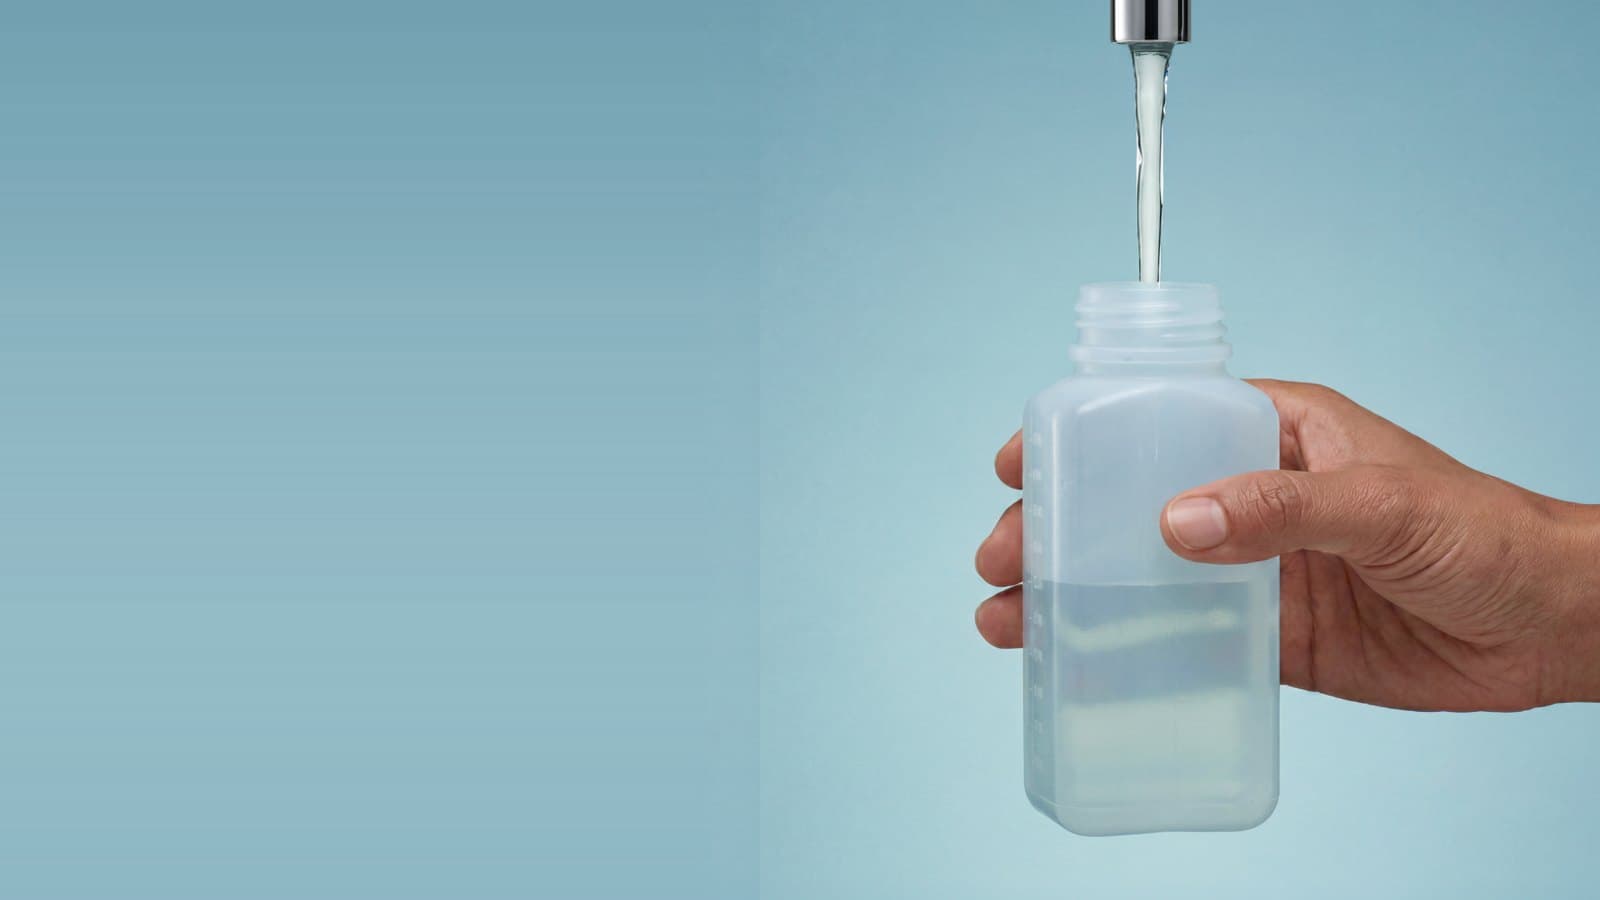
You can test your blood for lead. You can also test your kitchen tap for lead. They sound like the same question. They aren't1,2.
There's a lot of information out there about environmental exposures, and it can be hard to know what to measure, or how. Broadly, there are two approaches: measuring your home3 (the water, air, dust, and soil you live with) and measuring your body4,5 (biomarkers in blood or urine). Each answers a different question. Here's what each one tells you, what it doesn't, and how they fit together.
Biomarkers: what has made it into you
A biomarker test looks in a blood or urine sample for a chemical, the compounds your body breaks it down into, or other biological signs of exposure. It's evidence that something has actually entered your body, not just that it's somewhere in your environment. PFAS, for example, are detectable in the blood of nearly all Americans6.
Biomarkers sit downstream of the source. They tell you what's there, not how it got there7,8. A blood level can reflect your home, your job, your diet, the products you use, and the air outside, all blended into one number.
Home measurements: where it might be coming from
Home testing looks upstream, at the places exposures start: your drinking water, indoor air, household dust, soil, and surfaces. Because it points at a source, it also points at what you can change. If a water test finds a metal, for example, you can choose a filter certified to reduce that metal14.
The limits run the other way. Finding something in your home doesn't mean it has entered your body, or that it's at a level worth acting on. Lead in the soil by the back fence only reaches you if you, your kids, or the dog are in contact with that soil. Home readings are snapshots too. Levels shift with the season, ventilation, renovations, cleaning, water use, and weather15.
How the two compare
| Biomarker test | Home test | |
|---|---|---|
| The question it answers | What has made it into me? | What are we exposed to, and where is it coming from? |
| Where it sits | Downstream, in the body | Upstream, at the source |
| What it shows well | That a chemical actually reached the body | Which source to fix |
| What it can't show | Which source it came from | How much actually gets into your body |
| Who it covers | One person | Everyone sharing the space |
| Collecting it | Blood draw or urine sample, specialized lab, careful timing | Samples from the tap, air, or dust at home |
| Re-testing | Harder to repeat | Easier to repeat before and after a fix, like a new filter or purifier |
Neither gives the complete picture on its own. They answer different questions, and they work best together.
One person vs. the whole household
A biomarker describes one person at one moment. Two people under the same roof can have different levels because they eat different foods, spend different amounts of time at home, use different products, or process chemicals differently.
A home test describes a shared space. The same result applies to everyone who drinks that water, breathes that air, or crawls across that floor. That makes it especially useful when you're thinking about kids, a partner, or anyone else you live with.
Sharing a home doesn't mean everyone gets the same dose, though. Kids spend more time on the floor and closer to the dust16, and life stage can affect how sensitive someone is to certain exposures17.
So think of them as a pair:
What are we exposed to, and where is it coming from?
What has made it into me?
- 1.Lanphear, B. P. et al. The contribution of lead-contaminated house dust and residential soil to children’s blood lead levels. A pooled analysis of 12 epidemiologic studies. Environ. Res. 79, 51–68 (1998).
- 2.Triantafyllidou, S. & Edwards, M. Lead (Pb) in tap water and in blood: Implications for lead exposure in the United States. Crit. Rev. Environ. Sci. Technol. 42, 1297–1352 (2012).
- 3.Chow, J. C. et al. Chapter one: exposure measurements. Chemosphere 49, 873–901 (2002).
- 4.Needham, L. L., Calafat, A. M. & Barr, D. B. Uses and issues of biomonitoring. Int. J. Hyg. Environ. Health 210, 229–238 (2007).
- 5.Paustenbach, D. & Galbraith, D. Biomonitoring and biomarkers: exposure assessment will never be the same. Environ. Health Perspect. 114, 1143–1149 (2006).
- 6.Calafat, A. M., Wong, L.-Y., Kuklenyik, Z., Reidy, J. A. & Needham, L. L. Polyfluoroalkyl chemicals in the U.S. population: data from the National Health and Nutrition Examination Survey (NHANES) 2003-2004 and comparisons with NHANES 1999-2000. Environ. Health Perspect. 115, 1596–1602 (2007).
- 7.Angerer, J., Ewers, U. & Wilhelm, M. Human biomonitoring: state of the art. Int. J. Hyg. Environ. Health 210, 201–228 (2007).
- 8.Sobus, J. R. et al. Uses of NHANES biomarker data for chemical risk assessment: Trends, challenges, and opportunities. Environ. Health Perspect. 123, 919–927 (2015).
- 9.Li, Y. et al. Half-lives of PFOS, PFHxS and PFOA after end of exposure to contaminated drinking water. Occup. Environ. Med. 75, 46–51 (2018).
- 10.Hu, H., Shih, R., Rothenberg, S. & Schwartz, B. S. The epidemiology of lead toxicity in adults: measuring dose and consideration of other methodologic issues. Environ. Health Perspect. 115, 455–462 (2007).
- 11.Ye, X., Wong, L.-Y., Bishop, A. M. & Calafat, A. M. Variability of urinary concentrations of bisphenol A in spot samples, first morning voids, and 24-hour collections. Environ. Health Perspect. 119, 983–988 (2011).
- 12.LaKind, J. S. et al. A proposal for assessing study quality: Biomonitoring, Environmental Epidemiology, and Short-lived Chemicals (BEES-C) instrument. Environ. Int. 73, 195–207 (2014).
- 13.Zeise, L. et al. Addressing human variability in next-generation human health risk assessments of environmental chemicals. Environ. Health Perspect. 121, 23–31 (2013).
- 14.Bosscher, V., Lytle, D. A., Schock, M. R., Porter, A. & Del Toral, M. POU water filters effectively reduce lead in drinking water: a demonstration field study in flint, Michigan. J. Environ. Sci. Health A Tox. Hazard. Subst. Environ. Eng. 54, 484–493 (2019).
- 15.Laidlaw, M. A. S., Mielke, H. W., Filippelli, G. M., Johnson, D. L. & Gonzales, C. R. Seasonality and children’s blood lead levels: developing a predictive model using climatic variables and blood lead data from Indianapolis, Indiana, Syracuse, New York, and New Orleans, Louisiana (USA). Environ. Health Perspect. 113, 793–800 (2005).
- 16.Xue, J. et al. A meta-analysis of children’s hand-to-mouth frequency data for estimating nondietary ingestion exposure. Risk Anal. 27, 411–420 (2007).
- 17.Selevan, S. G., Kimmel, C. A. & Mendola, P. Identifying critical windows of exposure for children’s health. Environ. Health Perspect. 108 Suppl 3, 451–455 (2000).
Nestwell screens your home environment. Results describe your water, air, or dust and are not a medical diagnosis.
Frequently asked questions
- What's the difference between a biomarker test and a home test?
- A biomarker test looks in a blood or urine sample for signs that a chemical has entered your body. A home test looks at the water, air, dust, and soil you live with. A biomarker answers "What has made it into me?" A home test answers "What are we exposed to, and where is it coming from?"
- Can a blood test tell me where an exposure came from?
- No. A blood level can reflect your home, your job, your diet, the products you use, and the air outside, all blended into one number. A home test points at a source, which also points at what you can change.
- If something shows up in my home, is it in my body?
- Not necessarily. Finding something in your home doesn't mean it has entered your body, or that it's at a level worth acting on. Lead in the soil by the back fence only reaches you if someone is in contact with that soil.